Now You Know Characterization of Pore Structure in Textiles (Part-4)
Friday, 8 March 2019
Edit
Characterization of Pore Structure in Textiles (Part-4)

Arpita Kothari
M. Tech. Scholar
Department of Textile Technology,
NIT Jalandhar, India
Cell: +91- 7837-696041
Email: geniousarpita@gmail.com
-----Previous Part
5.5 The Relation between the Measured Pore Diameter and the Actual Pore Size:
Many pore cross-section may be considered to be elliptical with minor axis, d, and major axis, nd .Simply by assigning different numbers to the axial ratio, n, a variety of pore cross-sections may be represented. For a pore having elliptical cross-section: [1] 
Measured pore diameter, D

The largest particle that can pass through the elliptical pore is d. The ratio of the diameter, d, of the largest particle that can pass through and the measured pore diameter, D, is the pore shape factor,. It is given by:

The pore shape factors, [d/D], for a few typical cross-sections are listed in Table no. 5.
Table 7: Relation between measured and actual pore sizes
Table 7: Relation between measured and actual pore sizes
Filtration media Pore cross-section Shape factor

Measured pore diameters may be made comparable with d by including a multiplying factor,
Table 8. Comparison of the maximum diameter of particle that can pass through the pores obtained from fiber diameter and mesh count of the fabric and from the pore diameter measured by Porometer.
 5.5. Pore Distribution:
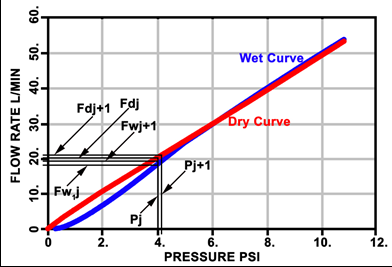
Let Fw,j and Fd,j be the flow rates through wet and dry samples respectively at the differential pressure pj corresponding to pore diameter, Dj, and Fw,j+1 and Fd,j+1 be the flow rates through wet and dry samples respectively at the next higher differential pressure pj+1 corresponding to pore diameter, Dj+1 as shown in figure 9: [1] 
 |
| Figure 9: Wet and dry curves showing flow rates at two consecutive readings. |
Pore distribution can be represented in three ways:
5.5.1. Pore size frequency:
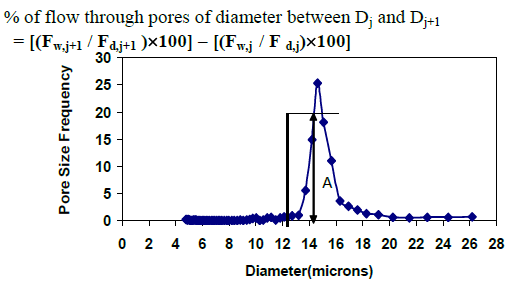
Pore size frequency defined by the percentage flow through pores in a given size range.
 |
| Figure 10: pore size frequency |
The quantity [(Fw,j / F d,j) × 100] plotted as a function of pore size is designated as cumulative filter flow by PMI in its report program. Figure 11 shows cumulative filter flow as a function of pore diameter. For example this figure shows that 45 % flow is through pores having diameter greater than 15 microns. [1]
 |
| Figure 11: Cumulative filter flow |
The pore size distribution function, fF. It is defined in the following manner:

Where the leading negative sign incorporates the fact that decrease in pore size increases the flow rate. The function is equal to the increase in percentage flow rate per unit increase in pore diameter. Integration of above Equation suggests that area under the distribution function in any pore diameter range (Figure 20) gives percentage flow in that diameter range. The distribution function gives the flow distribution over pore diameter. Because gas flow rate through a pore is proportional to the forth power of its diameter and number of such pores, the pore distribution is expected to be similar to the flow distribution, but shifted to lower pore diameters. Therefore, the flow distribution is designated as pore distribution. [1]
Since the increase in the percentage flow is determined essentially by the increase in the number of pores and the pore diameter, a sharp increase in pore size distribution suggests that the number of pores of that diameter is large.
 |
| Figure 12: Pore distribution |
5.6. Gas Permeability:
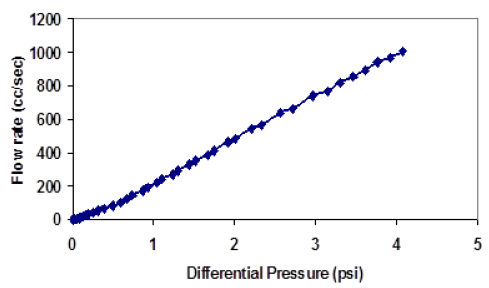
Gas flow rates measured through the dry sample is used to compute gas permeability using Darcy’s law. According to this law, flow of fluids through porous media is proportional to the pressure gradient causing flow.[1]

 |
| Figure 13: Plot of standard volume flow rate of air versus differential pressure for a filter. |
5.7. Envelope Surface Area:
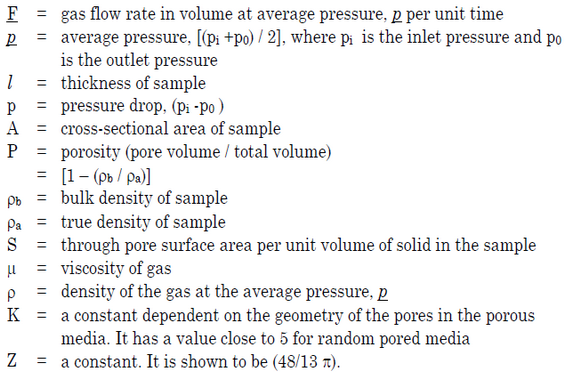
The surface area of through pores, which allow gas to pass through, is considered the envelope surface area. flow rate of gas through a porous media can be expressed by the following equation:[1]

Where,

This technique measures the envelope surface area, which can not be measured by any other technique. The technique has the added advantage of experimental simplicity.
Errors are introduced in the measurement can be reduced if the flow is primarily viscous. When the volumes of closed pores and blind pores are negligible, the porosity, which enters in to calculation, is primarily due to through pores. However, if the volume of closed and blind pores is appreciable, the porosity value would be greater than that due to only the through pores and would introduce errors in the envelope surface area calculation. Errors are also introduced when the largest pore diameter is much larger than the average pore diameter, because large diameter pores make excessively low contribution to surface area, while there contribution to flow is much in excess of their number.
6. Development in characterization technique:
6.1. Flowmetry with extended capability:
The technique is being constantly updated and has undergone many changes during the recent years. [4]
- Advanced Flow Porometry[3] (Fully Automated & Computer Controlled Device)
- Microflow Porometry (Measures very low permeability samples)
- In-Plane Porometry (Directional Porometry) (Measures pore structure in any orientation & of layers)
- Compression Porometry (Measures pore structure of sample under stress)
- Cyclic Compression Porometry (Measures pore structure of sample under cyclic stress)
- Clamp-On Porometry (no need of sample cutting from bulk material)
- Nanopore Porometry (Measures pore diameter down to O.005m)
- A new image-based PSD determination method has been developed for nonwoven geotextiles
- The method uses planar and cross-sectional views to capture the 3D structure of a nonwoven geotextile using an optical light microscope[8]
- The method consists of three steps: specimen preparation, image analysis, and pore opening size determination.
- The image analysis method was developed using various mathematical morphology algorithms to determine geotextile pore opening sizes, O95 and O50 Finally, the measured values were checked against the manufacturer’s reported AOS values
- Pore size and its distribution is one of the very important physical parameter, which can be defined by many characteristics.
- Each technique used for characterizing the pore structure has their own capabilities and limitations.
- Each of the characteristic may be critical in certain end use application.
- Flow porometry is a highly versatile technique capable of measuring many pore characteristics.
- The image analysis method is unique and can measure fiber thickness and pore opening sizes in a given image.
- It is clear that adequate characterization of textiles is essential for development of novel textiles and deciding suitability of textiles for applications.
- “Wetting Liquid Extrusion Techniques: Part I- Capillary Flow Porometry”, Dr. Akshaya Jena, Porous Materials, Inc., USA
- “Pore Structure of Textile Material”, V. K. Kothari & A. Mukhopadhyay, Indian Textile J., 109, No. 11 (1999) pp. 8-23.
- “Capillary flow porometry with Extended Capability”, Dr. Krishna Gupta, Porous Materials Inc. USA.
- Presentation on “Advances in pore structure evaluation by porometry”, Dr. Akshaya Jena, Dr. Krishna Gupta, Porous Materials, Inc., USA.
- Brochure of Porous Materials, Inc., USA.
- Presentation on “Methods for characterization of porous materials”, Centre of excellence POEMES, Bulgarian Academy of Sciences.
- Presentation on “Pore Structure of Advanced Textiles” , Dr. Akshaya Jena & Dr. Krishna Gupta, Porous Materials, Inc., New York, USA.
- “Digital Image Analysis to Determine Pore Opening Size Distribution of Nonwoven Geotextiles”, Ahmet H. Aydilek, Seyfullah and Tuncer, Journal of Computing in Civil Engineering, October 2002, pp.280- 290.
- N.C.Ray, Presentation on, “Pore size measurement and its analysis”