Now You Know Merits and Limitations of Cotton Fiber Length Measuring Instruments (Part-2)
Saturday, 2 February 2019
Edit
Merits and Limitations of Cotton Fiber Length Measuring Instruments (Part-2)
N.Balasubramanian
Retd Jt. Director (BTRA) and Consultant
I, Rajeswari, 36, 17th Road, Chembur, Mumbai 400071, 9869716298
Email: balajamuna@gmail.com
Retd Jt. Director (BTRA) and Consultant
I, Rajeswari, 36, 17th Road, Chembur, Mumbai 400071, 9869716298
Email: balajamuna@gmail.com
Previous Part
Short Fibre Content (SFC)
SFC is indicated in 2 different ways. 1.% of fibres lower than a certain length (usually 0.5 inch) 2.% of fibres less than Effective length from Baer sorter.
Balls sorter, Baer Sorter, and Suter web sorter give the most accurate estimate of SFC though they are time consuming. Digital Fibrograph and HVI, though rapid, give unreliable estimate. From fibrograph, baer sorter curve can be obtained by differential method and SFC can be obtained.
Table 2 gives span lengths and UI of fibrogrpah determined by double summation method from original frequency distribution with 3 cottons of nearly same mean length but differing in short fibre content (SFC %). UI is nearly the same for the 3 samples though SFC % is markedly different. This is because both 2.5 % and 50 % span lengths are reduced in the same proportion with increase in SFC %. This amply demonstrates that UI by fibrograph cannot give any indication of short fibre content.
Table 2 : Comparison of 50%, 2.5 % span length and UI with short fibre content %
Mean fibre length,mm | 26.8 | 25.6 | 25.2 |
CV % | 28.9 | 30.6 | 32.8 |
SFC % | 7.3 | 12 | 14 |
50 % Span length, mm | 16.6 | 13.6 | 14 |
2.5 % Span length | 36.6 | 29.8 | 29.7 |
UI % | 45.5 | 45.6 | 45.6 |
Cai12 et al found that the sampling in the beard of HVI is not truly length biased. Except in short fibre region the sample is similar to that of original sample. SFC by HVI is lower than of original because of sampling. Chu and Riley13 also found that the sample in the comb prepared by fibre sampler is not a length biased sample. Each fibre irrespective of its length has equal probability of being caught by the comb As a result, mean length and length distribution of fibres in the fibrosampler are close to mean length and length distribution in the original sample. This seems to indicate that fibres are picked by the sampler in clumps rather than individually. Some support to this contention is found in the results of Carpenter10. Actual Fibrogram and that derived from comb sorter results have been compared by Carpenter ( Fig 2). Actual fibrogram deviates from that derived from comb sorter, with divergence increasing with length. As a result fibre length and short fibre content are under estimated.
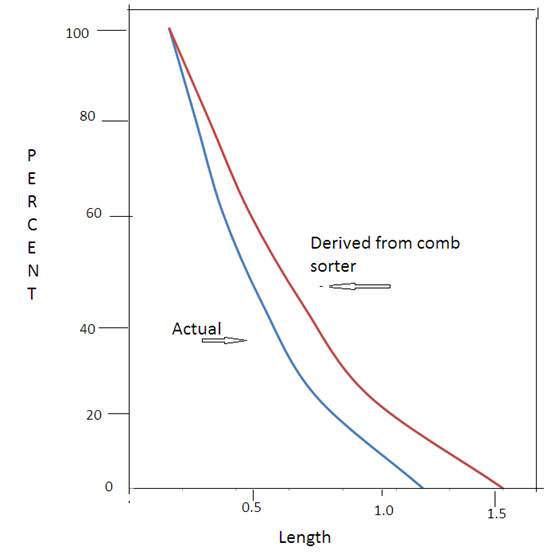 |
| Fig 2 : Actual fbgrogram and that derived from Comb sorter |
High volume Instruments (HVI) have speeded up testing of fibre length apart from other properties substantially. Bale wise testing of cottons is possible and bales with substandard characteristics can be weeded out. HVI determines length characteristics based on Digital Fibrograph principle. ASTM, Standard D 5867-05 specifies the Standard Test Method for Measurement of Physical Properties of Cotton Fibers by High Volume Instruments. Calibration cottons by USDA are used to calibrate the instrument.
Limitations
1. Fibre breakages occur during comb preparation on HVI as this is done at high speed. Such breakages are more with harsh, entangled cottons.
2. Further some length of fibre is used in clamping on the comb as in Fibrograph leading to lower estimates of fibre length.
3. Breakages are also higher with card sliver compared to comber sliver. Over estimation of fibre fractionation is therefore found in HVI.
4. As mentioned earlier,Cai12 et al and Chu and Riley13 however found that the sampling used in HVI is not length biased but follows original distribution. This is supported by the work of Cui14 et al. The authors found a close agreement between frequency length distribution of cotton of original sample and that of fibres picked by the clamp in fibrosampler. If fibrosampler sample is length biased as assumed by Hertel, then it should agree with length biased mean obtained from the mean and CV of original sample. In Table 3 below mean length of original and Fibrosampler picked sample and length biased mean calculated from mean and CV of original sample from the data given by Cui14 et al are given
Table 3 : Comparison of mean fibre length of fibrosampler picked sample with original sample
Sample identification No | Mean fiber length of original sample, cm | Mean fiber length of Fibro sampler picked sample, cm | Length biased mean fiber length calculated from original sample, cm |
30 | 1.666 | 1.740 | 2.42 |
31 | 1.754 | 1.782 | 2.542 |
33 | 1.873 | 1.937 | 2.266 |
34 | 2.041 | 2.071 | 2.399 |
35 | 2.058 | 1.999 | 2.419 |
36 | 2.145 | 2.151 | 2.553 |
37 | 2.176 | 2.255 | 2.597 |
38 | 2.284 | 2.324 | 2.710 |
Table 3 shows that while mean fibre length of original and fibrosampler picked samples are close to each other, length biased mean estimated from original sample is much higher in all the cases. This would mean that fibrosampler picked sample is not length biased as assumed by Hertel.
Another interesting finding is that projecting portion from the clamp has a higher fibre length than that hidden behind the clamp. Further twice the mean length from projected sample is much higher than mean length of fibrosampler picked sample. It appears that these anomalies have arisen either because of the method followed in collecting projected portion and hidden portion from the clamp or because fibres get dragged forward while being picked in the comb.
To find out the effect of fibre length variability on differences caused in probability of fibre picking in fibrosampler, fibrograms prepared assuming equal probability for fibres is compared against that with length biased probability in fibrosampler are compared for cottons with low and high fibre length variability in Figs 3 and 4 .
 |
| Fig 3 : Comparison of fibrograms with equal probability for fibres and length biased probability in fibrosampler beard of high variability cotton, Mean length 26.8 mm, CV = 28.9 % |
 |
| Fig 4 : Comparison of fibrograms with equal probability for fibres and length biased probability in fibrosampler beard of low variability cotton, Mean length 26.8 mm, CV = 14.5 % % |
Table 4 : Comparison of span lengths with equal probability for fibres and length biased probability in fibrosampler beards
 |
| (Click on image for large size) |
Belmasrour38 et al proposed a method for estimating fibre length distribution of a sample from length distribution of fibres projecting from the comb of fibrograph. Predicted curve gives good agreement with experimental except in short fibre region. CV of fibre length for the projecting fibre sample (from the fibrograph comb) was calculated for constant staple length, low and high length variability original samples are given in Table 5. CV of fibre length is as high as 57.7 % for cut staple and increases marginally to 60 % in low variability sample and to 66% in high variability sample. High variability in beard sample is because of random clamping of fibre which is akin to random breakage of fibre. Variability of fibre length in original sample has only a marginal effect on variability in beard sample. Beard sample with length biased picking has a lower variability than equal probability picking.
Table 5 : CV of fibre length for the projecting fibre sample (from the fibrograph comb) for constant staple length, low and high length variability original samples
 | |
| (Click on image for large size) |