Now You Know Prediction of Tensile Strength of Woven Fabric
Monday, 4 February 2019
Edit
Comparative Study Regarding the Prediction Efficiency of Ann and Fuzzy Model for the Prediction of “Tensile Strength” of Woven Fabric
Amal Ray
M.Tech Scholar
Govt. College of Engineering & Textile Technology,
Serampore, West Bengal, India
Email: amal.pappu87@gmail.com
Govt. College of Engineering & Textile Technology,
Serampore, West Bengal, India
Email: amal.pappu87@gmail.com
Abstract:
The significant of fabric Tensile Strength is clearly understood in Context of the endues properties of the fabric. Therefore Tensile Strength must be pre-ashes during the fabric designing, I that is selection of warp count weft count, selection of fabric structural properties. Weave, EPC, PPC, and physical properties like GSM, Thickness.
Therefore it is essential to establish a suitable empirical relationship between Tensile Strength of fabric and basic fabric parameter GSM, EPC, PPC, Thickness. In the present paper number of fabric sample is plane to be tested to create set off observation value GSM, PPC, EPC, Thickness as input parameter and Tensile Strength is output.
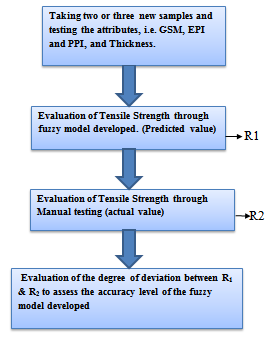
The ANN model and fuzzy model are plane to be derived based upon those observation data. The prediction efficacies of this to prediction model to be drive our plain to be compared to obtain. The most accurate prediction model for Tensile Strength.
Chapter-1: INTRODUCTION
Tensile strength of a yarn or fabric is defined as a maximum load that it will endure without breaking when subjected to uniaxial tensile loading. Tensile strength of a woven fabric is one of the most important properties which make it superior in many applications as compared to non-woven and knitted fabrics. Literature review reveals that the tensile strength of a woven fabric not only depends on the strength of the constituent yarns, but also on many other factors including yarn linear density, yarn twist per unit length, twist direction, yarn structure as influenced by the spinning system, yarn bending behaviour, coefficient of friction and initial modulus of the yarn, fabric geometry, warp and weft density, weave design or yarn interlacement pattern, weaving conditions (such as temperature, humidity and yarn tensions during weaving) as well as fabric finishing treatments.
Artificial neural network (ANN) is being extensively used at a research stage in all the fields of textile industry since last two decade. Artificial neural network is applied in every field of textile industry i.e. spinning engineering, weaving engineering, dyeing engineering, etc. As neural network are disable provided used individually they are generally integrated with an constant system to be used in engineering approach. Different models embedded with neural network such as “automated textile defect recognizer”, “universal approximation”, “MCE criterion”, etc. are used into different sectors of textile industry. This paper mainly focuses on fabric engineering. Artificial neural network is one of the hopes available to integrate the elements such as production, quality, cost, information, and static process control just in time, manufacturing computer integrated manufacturing, classification at fabric patterns, identifying fabric defects, etc.
Fuzzy logic is a form of many-valued logic; it deals with reasoning that is approximate rather than fixed and exact. Compared to traditional binary sets (where variables may take on true or false values) fuzzy logic variables may have a truth value that ranges in degree between 0 and 1. Fuzzy logic has been extended to handle the concept of partial truth, where the truth value may range between completely true and completely false. Furthermore, when linguistic variables are used, these degrees may be managed by specific functions. Irrationality can be described in terms of what is known as the fuzzy.
The Japanese were the first to utilize fuzzy logic for practical applications. The first notable application is on the high-speed train in Sendai, in which fuzzy logic is able to improve the economy, comfort, and precision of the ride. It has also been used in recognition of hand written symbols in Sony pocket computers, earthquake prediction and modelling at the Institute of Seismology Bureau of Metrology in Japan, etc.
1.1: Significance of Tensile Strength of Woven Fabric:-
Among all mechanical properties, most important is tensile property behaviour under forces. Experimentally it is the elongation and finally the break under gradually increasing load. Textile material are not uniform their composition and along the lengths. Consequently their tensile properties are also variable. The variability of result of tensile testing is mainly on test length and test speed. The aim of dissertation is to find effect of test length and test speed on tensile testing and also to find out suitable test length and test speed for a testing of woven fabrics. Tensile strength of the sample is determined by using ASTM D5034 method. This test method covers the grab and modified grab test procedures for the determining the breakage strength and elongation of the most textile fabrics. The grab test procedure is applicable to woven, non-woven and felted fabrics. While the modified grab test is used primarily for woven fabrics. This test method is not recommended for glass fabrics or for knitted and other textile fabrics which have high stretch.
 |
| Figure01-Tensile strength test of fabric |
- The specimen is mounted securely in the clamps of the testing machine (Instron). Take care that the specimen is centrally located and the long dimension is as nearly parallel as possible to the direction of force application. Be sure that the tension on the specimens is uniform across the clamped width.
- Mark across the specimen at the front inner edge of each jaw to check for specimen slips. When slips occurs, the mark will move away from the jaws edge.
- The machine is operated and the specimen were broken one by one first warp wise and then weft wise.
- The breaking force is recorded from the mechanism proved for such purpose.
- If specimen slips in the jaws, or breaks, at the edge of or in the jaws, or if for any reason the result fall markedly below the average of the set of specimens, discard the results and take another specimen. Continue this until the required number of except able breaks has been obtained. In the absence of other criteria for rejection a jaw break, any break occurring within 5 mm of the jaws which results in the value below 50 % of the average of all other break should be discarded. No other break should be discarded unless it is known to be faulty.
Instron is most common testing machine used in tensile testing is the universal testing machine. This type of machine has two crossheads; one is adjusted for the length of the specimen and the other is driven to apply tension to the test specimen. There are two types: i) hydraulic powered and ii) electromagnetically powered machines.
The machine must have the proper capabilities for the test specimen being tested. There are three main parameters: force capacity, speed, and precision and accuracy. Force capacity refers to the fact that the machine must be able to generate enough force to fracture the specimen. The machine must be able to apply the force quickly or slowly enough to properly mimic the actual application. Finally, the machine must be able to accurately and precisely measure the gauge length and forces applied; for instance, a large machine that is designed to measure long elongations may not work with a brittle material.
The test process involves placing the test specimen in the testing machine and applying tension to it until it fractures. During the application of tension, the elongation of the gauge section is recorded against the applied force. The data is manipulated so that it is not specific to the geometry of the test sample. The elongation measurement is used to calculate the engineering strain, using the following equation:-
 Where, L is the change in gauge length, L0 is the initial gauge length, and L is the final length. The force measurement is used to calculate the engineering stress, s, using the following equation:
  Where F is the force and A is the cross-section of the gauge section. The machine does these calculations as the force increases, so that the data points can be graphed into a stress-strain curve.
1.3: Introduction to ANN:-
In computer science and related fields, artificial neural networks are computational models inspired by animal central nervous systems (in particular the brain) that are capable of machine learning and pattern recognition. They are usually presented as systems of interconnected "neurons" that can compute values from inputs by feeding information through the network.
For example, in a neural network for handwriting recognition, a set of input neurons may be activated by the pixels of an input image representing a letter or digit. The activations of these neurons are then passed on, weighted and transformed by some function determined by the network's designer, to other neurons, etc., until finally an output neuron is activated that determines which character is read.
This specification covers the operating characteristics of three types of tensile testing machines used for the determination of the force-elongation properties of textile materials.
These types of tensile testing machines are:-
Calculation—the effective gauge length can be calculated using the following equation:  Where:
G E = effective gauge length,
G N = nominal gauge length,
E N = percent elongation based on nominal gauge length, and
ET = percent elongation based on true gauge length.
1.4: Introduction to fuzzy logic::
Fuzzy logic is a form of many-valued logic; it deals with reasoning that is fixed or approximate rather than fixed and exact. In contrast with "crisp logic", where binary sets have two-valued logic: true or false, fuzzy logic variables may have a truth value that ranges in degree between 0 and 1. Fuzzy logic has been extended to handle the concept of partial truth, where the truth value may range between completely true and completely false. Furthermore, when linguistic variables are used, these degrees may be managed by specific functions. Fuzzy logic began with the 1965 proposal of fuzzy set theory by LotfiZadeh et.al[7]. Though fuzzy logic has been applied to many fields, from control theory to artificial intelligence, it still remains controversial among most statisticians, who prefer Bayesian logic, and some control engineers, who prefer traditional two-valued logic.
Degrees of truth:
Fuzzy logic and probabilistic logic are mathematically similar – both have truth values ranging between 0 and 1 – but conceptually distinct, due to different interpretations. Fuzzy logic corresponds to "degrees of truth", while probabilistic logic corresponds to "probability, likelihood"; as these differ, fuzzy logic and probabilistic logic yield different models of the same real-world situations.
Both degrees of truth and probabilities range between 0 and 1 and hence may seem similar at first. For example, let a 100 ml glass contain 30 ml of water. Then we may consider two concepts: Empty and Full. The meaning of each of them can be represented by a certain fuzzy set. Then one might define the glass as being 0.7 empty and 0.3 full. Note that the concept of emptiness would be subjective and thus would depend on the observer or designer. Another designer might equally well design a set membership function where the glass would be considered full for all values down to 50 ml. It is essential to realize that fuzzy logic uses truth degrees as a mathematical model of the vagueness phenomenon while probability is a mathematical model of ignorance. The same could be achieved using probabilistic methods, by defining a binary variable "full" that depends on a continuous variable that describes how full the glass is. There is no consensus on which method should be preferred in a specific situation.
Applying truth values:
A basic application might characterize sub ranges of a continuous variable. For instance, a temperature measurement for anti-lock brakes might have several separate membership functions defining particular temperature ranges needed to control the brakes properly. Each function maps the same temperature value to a truth value in the 0 to 1 range. These truth values can then be used to determine how the brakes should be controlled.
Fuzzy logic temperature:
In this image, the meaning of the expressions cold, warm, and hot is represented by functions mapping a temperature scale. A point on that scale has three "truth values"—one for each of the three functions. The vertical line in the image represents a particular temperature that the three arrows (truth values) gauge. Since the red arrow points to zero, this temperature may be interpreted as "not hot". The orange arrow (pointing at 0.2) may describe it as "slightly warm" and the blue arrow (pointing at 0.8) "fairly cold".
Linguistic variables:
While variables in mathematics usually take numerical values, in fuzzy logic applications, the non-numeric linguistic variables are often used to facilitate the expression of rules and facts.
A linguistic variable such as age may have a value such as young or its antonym old. However, the great utility of linguistic variables is that they can be modified via linguistic hedges applied to primary terms. The linguistic hedges can be associated with certain functions.
Example:
Fuzzy set theory defines fuzzy operators on fuzzy sets. The problem in applying this is that the appropriate fuzzy operator may not be known. For this reason, fuzzy logic usually uses IF-THEN rules, or constructs that are equivalent, such as fuzzy associative matrices.
Rules are usually expressed in the form:
IF variable IS property THEN action
For example, a simple temperature regulator that uses a fan might look like this:
The AND, OR, and NOT operators of Boolean logic exist in fuzzy logic, usually defined as the minimum, maximum, and complement; when they are defined this way, they are called the Zadeh operators. So for the fuzzy variables x and y:
NOT x = (1 - truth(x))
x AND y = minimum(truth(x), truth(y))
x OR y = maximum(truth(x), truth(y))
There are also other operators, more linguistic in nature, called hedges that can be applied. These are generally adverbs such as "very", or "somewhat", which modify the meaning of a set using a mathematical formula.
Chapter 2: Literature Review:-
As per the paper of Zulfiqar Ali Malik et.al[1] Tensile strength has been accepted as one of the most important performance attributes of woven textiles. In this work, multiple linear regression models are developed by using empirical data for the prediction of woven fabric tensile strength manufactured from cotton yarns. Tensile strength of warp & weft yarns, warp & weft fabric density, and weave design were used as input parameters to determine warp- and weft-way tensile strength of the woven fabrics. The developed models are able to predict the fabric strength with very good accuracy. Warp yarn strength and ends per 25 mm are found to be the most dominant factors influencing fabric strength in warp direction while weft yarn strength and picks per 25 mm are most vital in weft direction.
As per the paper of Mithat Zeydan et.al[2] traditional and computational modelling techniques are compared between each other to predict woven fabric strength that is one of the main features for the characterization of woven fabric quality and fabric performance. Compared the other classical modelling techniques, computational modelling methodology seems to have been more robust and appropriate. This study made in a textile Factory producing jacquard woven bedding fabric in Turkey has many benefits for textile manufacturers to reduce waste and scrap ratio before and during manufacturing. Firstly, production planning function in the plant will be able to predict the woven fabric strength easily to be known optimal parameter setting before manufacturing. Secondly, The significant parameter in the manufacturing is found as Warp Density. Thirdly, after finding the optimum parameter setting with TDOE, interval values of the sensitive parameters in the production is found with ANN approach.
As per the paper of P.Banumathi et.al[3] a new intelligent fabric defect inspection model is presented. The recognizer acquires digital fabric images by image acquisition device and converts that image into binary image by restoration and threshold techniques. The output of the processed image is used as an input to the Neural Network (NN) which uses back propagation algorithm to calculate the weighted factors and generates the desired classification of defects as an output. The experiment results show that the proposed method is feasible and applicable in textile production factories for defect detection and classification.
In the paper of Faten Fayala et.al[4] thermal conductivity as a physical characteristic of fabric. This phenomenon depends on many fabric parameters and it is difficult to study the effect of ones without changing the others. In addition, the non-linear relationship of fabric parameters and thermal conductivity handicap mathematical modelling. So a neural network approach is used to predict the thermal conductivity of knitting structure as a function of porosity, air permeability, weight and fiber conductivity. Data on thermal conductivity are measured by experiments carried out on jersey knitted structure.
As per the paper of J.L. DGRJUTY G. VACHTSEVANOS et.al[5] A hierarchical control architecture is proposed has been developed and is applied to textile processes based upon experimental input-output data A rule-based fuzzy modelling technique is applied to the Drying subsystem of the process. A FLC is used to control moisture content in the yam and is shown to outperform a conventional control law. An experimental data-base is compiled describing the slashed yarn characteristics which are used to construct the fuzzy model and to derive the global optimization routines for the hierarchical supervisor level. Control loops for the slasher model have also been simulated on a PC486 machine to design and compare new control strategies. We have developed a simulation of a slasher on the Honeywell automated process control platform. It demon & rates the present control strategy, its limitations and potential for improvement. Fuzzy control in a hierarchical system has the potential for dramatically improving slashing and weaving performance.
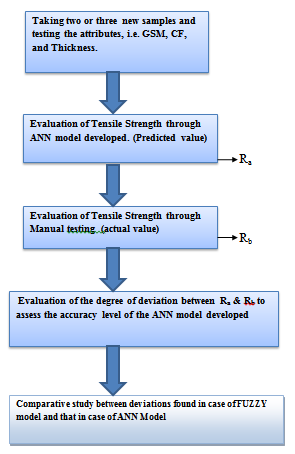
Chapter-3:- ACTION PLAN:: 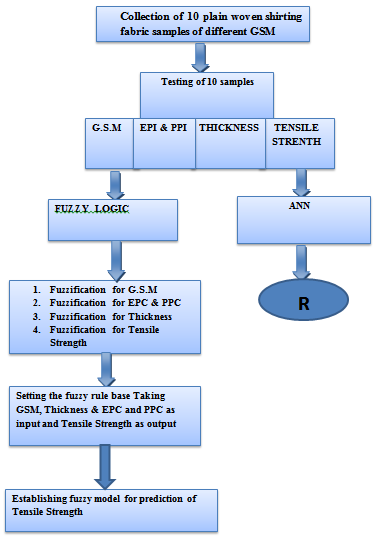

References::
The machine must have the proper capabilities for the test specimen being tested. There are three main parameters: force capacity, speed, and precision and accuracy. Force capacity refers to the fact that the machine must be able to generate enough force to fracture the specimen. The machine must be able to apply the force quickly or slowly enough to properly mimic the actual application. Finally, the machine must be able to accurately and precisely measure the gauge length and forces applied; for instance, a large machine that is designed to measure long elongations may not work with a brittle material.
The test process involves placing the test specimen in the testing machine and applying tension to it until it fractures. During the application of tension, the elongation of the gauge section is recorded against the applied force. The data is manipulated so that it is not specific to the geometry of the test sample. The elongation measurement is used to calculate the engineering strain, using the following equation:-


 |
| Figure.- 02 |
In computer science and related fields, artificial neural networks are computational models inspired by animal central nervous systems (in particular the brain) that are capable of machine learning and pattern recognition. They are usually presented as systems of interconnected "neurons" that can compute values from inputs by feeding information through the network.
For example, in a neural network for handwriting recognition, a set of input neurons may be activated by the pixels of an input image representing a letter or digit. The activations of these neurons are then passed on, weighted and transformed by some function determined by the network's designer, to other neurons, etc., until finally an output neuron is activated that determines which character is read.
 |
| Figure.- 03 |
These types of tensile testing machines are:-
- Constant-rate-of-extension, CRE.
- Constant-rate-of-traverse, CRT.
- Constant-rate-of-loading (force), CRL.
Calculation—the effective gauge length can be calculated using the following equation:

G E = effective gauge length,
G N = nominal gauge length,
E N = percent elongation based on nominal gauge length, and
ET = percent elongation based on true gauge length.
1.4: Introduction to fuzzy logic::
Fuzzy logic is a form of many-valued logic; it deals with reasoning that is fixed or approximate rather than fixed and exact. In contrast with "crisp logic", where binary sets have two-valued logic: true or false, fuzzy logic variables may have a truth value that ranges in degree between 0 and 1. Fuzzy logic has been extended to handle the concept of partial truth, where the truth value may range between completely true and completely false. Furthermore, when linguistic variables are used, these degrees may be managed by specific functions. Fuzzy logic began with the 1965 proposal of fuzzy set theory by LotfiZadeh et.al[7]. Though fuzzy logic has been applied to many fields, from control theory to artificial intelligence, it still remains controversial among most statisticians, who prefer Bayesian logic, and some control engineers, who prefer traditional two-valued logic.
Degrees of truth:
Fuzzy logic and probabilistic logic are mathematically similar – both have truth values ranging between 0 and 1 – but conceptually distinct, due to different interpretations. Fuzzy logic corresponds to "degrees of truth", while probabilistic logic corresponds to "probability, likelihood"; as these differ, fuzzy logic and probabilistic logic yield different models of the same real-world situations.
Both degrees of truth and probabilities range between 0 and 1 and hence may seem similar at first. For example, let a 100 ml glass contain 30 ml of water. Then we may consider two concepts: Empty and Full. The meaning of each of them can be represented by a certain fuzzy set. Then one might define the glass as being 0.7 empty and 0.3 full. Note that the concept of emptiness would be subjective and thus would depend on the observer or designer. Another designer might equally well design a set membership function where the glass would be considered full for all values down to 50 ml. It is essential to realize that fuzzy logic uses truth degrees as a mathematical model of the vagueness phenomenon while probability is a mathematical model of ignorance. The same could be achieved using probabilistic methods, by defining a binary variable "full" that depends on a continuous variable that describes how full the glass is. There is no consensus on which method should be preferred in a specific situation.
Applying truth values:
A basic application might characterize sub ranges of a continuous variable. For instance, a temperature measurement for anti-lock brakes might have several separate membership functions defining particular temperature ranges needed to control the brakes properly. Each function maps the same temperature value to a truth value in the 0 to 1 range. These truth values can then be used to determine how the brakes should be controlled.
 |
| Figure 05 |
In this image, the meaning of the expressions cold, warm, and hot is represented by functions mapping a temperature scale. A point on that scale has three "truth values"—one for each of the three functions. The vertical line in the image represents a particular temperature that the three arrows (truth values) gauge. Since the red arrow points to zero, this temperature may be interpreted as "not hot". The orange arrow (pointing at 0.2) may describe it as "slightly warm" and the blue arrow (pointing at 0.8) "fairly cold".
Linguistic variables:
While variables in mathematics usually take numerical values, in fuzzy logic applications, the non-numeric linguistic variables are often used to facilitate the expression of rules and facts.
A linguistic variable such as age may have a value such as young or its antonym old. However, the great utility of linguistic variables is that they can be modified via linguistic hedges applied to primary terms. The linguistic hedges can be associated with certain functions.
Example:
Fuzzy set theory defines fuzzy operators on fuzzy sets. The problem in applying this is that the appropriate fuzzy operator may not be known. For this reason, fuzzy logic usually uses IF-THEN rules, or constructs that are equivalent, such as fuzzy associative matrices.
 |
| Figure.- 06 |
IF variable IS property THEN action
For example, a simple temperature regulator that uses a fan might look like this:
- IF temperature IS very cold THEN stop fan
- IF temperature IS cold THEN turn down fan
- IF temperature IS normal THEN maintain level
- IF temperature IS hot THEN speed up fan
The AND, OR, and NOT operators of Boolean logic exist in fuzzy logic, usually defined as the minimum, maximum, and complement; when they are defined this way, they are called the Zadeh operators. So for the fuzzy variables x and y:
NOT x = (1 - truth(x))
x AND y = minimum(truth(x), truth(y))
x OR y = maximum(truth(x), truth(y))
There are also other operators, more linguistic in nature, called hedges that can be applied. These are generally adverbs such as "very", or "somewhat", which modify the meaning of a set using a mathematical formula.
Chapter 2: Literature Review:-
As per the paper of Zulfiqar Ali Malik et.al[1] Tensile strength has been accepted as one of the most important performance attributes of woven textiles. In this work, multiple linear regression models are developed by using empirical data for the prediction of woven fabric tensile strength manufactured from cotton yarns. Tensile strength of warp & weft yarns, warp & weft fabric density, and weave design were used as input parameters to determine warp- and weft-way tensile strength of the woven fabrics. The developed models are able to predict the fabric strength with very good accuracy. Warp yarn strength and ends per 25 mm are found to be the most dominant factors influencing fabric strength in warp direction while weft yarn strength and picks per 25 mm are most vital in weft direction.
As per the paper of Mithat Zeydan et.al[2] traditional and computational modelling techniques are compared between each other to predict woven fabric strength that is one of the main features for the characterization of woven fabric quality and fabric performance. Compared the other classical modelling techniques, computational modelling methodology seems to have been more robust and appropriate. This study made in a textile Factory producing jacquard woven bedding fabric in Turkey has many benefits for textile manufacturers to reduce waste and scrap ratio before and during manufacturing. Firstly, production planning function in the plant will be able to predict the woven fabric strength easily to be known optimal parameter setting before manufacturing. Secondly, The significant parameter in the manufacturing is found as Warp Density. Thirdly, after finding the optimum parameter setting with TDOE, interval values of the sensitive parameters in the production is found with ANN approach.
As per the paper of P.Banumathi et.al[3] a new intelligent fabric defect inspection model is presented. The recognizer acquires digital fabric images by image acquisition device and converts that image into binary image by restoration and threshold techniques. The output of the processed image is used as an input to the Neural Network (NN) which uses back propagation algorithm to calculate the weighted factors and generates the desired classification of defects as an output. The experiment results show that the proposed method is feasible and applicable in textile production factories for defect detection and classification.
In the paper of Faten Fayala et.al[4] thermal conductivity as a physical characteristic of fabric. This phenomenon depends on many fabric parameters and it is difficult to study the effect of ones without changing the others. In addition, the non-linear relationship of fabric parameters and thermal conductivity handicap mathematical modelling. So a neural network approach is used to predict the thermal conductivity of knitting structure as a function of porosity, air permeability, weight and fiber conductivity. Data on thermal conductivity are measured by experiments carried out on jersey knitted structure.
As per the paper of J.L. DGRJUTY G. VACHTSEVANOS et.al[5] A hierarchical control architecture is proposed has been developed and is applied to textile processes based upon experimental input-output data A rule-based fuzzy modelling technique is applied to the Drying subsystem of the process. A FLC is used to control moisture content in the yam and is shown to outperform a conventional control law. An experimental data-base is compiled describing the slashed yarn characteristics which are used to construct the fuzzy model and to derive the global optimization routines for the hierarchical supervisor level. Control loops for the slasher model have also been simulated on a PC486 machine to design and compare new control strategies. We have developed a simulation of a slasher on the Honeywell automated process control platform. It demon & rates the present control strategy, its limitations and potential for improvement. Fuzzy control in a hierarchical system has the potential for dramatically improving slashing and weaving performance.
Chapter-3:- ACTION PLAN::


References::
- Zulfiqar Ali Malik et.al[1]/ Development of Models to Predict Tensile Strength of Cotton Woven Fabrics Volume 6 http://www.jeffjournal.org /Journal of Engineered Fibers and Fabrics /2011.
- Mithat Zeydan / Prediction of Fabric Tensile Strength by Modelling the Woven Fabric/ www.intechopen.com/ Erciyes University, Department of Industrial Engineering Turkey.
- P. Banumathi and Dr. G. M. Nasira et.al[3]/Fabric Inspection System using Artificial Neural Networks Volume- II/International Journal of Computer Engineering Science(IJCES) https://sites.google.com/site/ijcesjournal/2012 5th May.
- Faten Fayala(Ph.D), Sofien Benltoufa(Ph.D), Abdelmajid Jemni(Ph.D) and Hamza Alibi(Ph.D)/ Neural Network for Predicting Thermal Conductivity of Knit Materials/ Journal of Engineered Fibers and Fabrics. Volume 3, Issue 4 – 2008.
- J.L. DGRJUTY G. VACHTSEVANOS et.al[5]/ ADVANCED APPLICATION OF STATISTICAL AND FUZZY LOGIC CONTROL TO TEXTILE PROCESSES/ National Textile Centre Annual Report/ 1994 September.
- Soft Computing in textile Engineering./ Woodhead publication/ 2011.