Now You Know Statistical Quality Control in Apparel Industry
Sunday, 3 February 2019
Edit
Statistical Quality Control in Apparel Industry

R.S .Balakumar
M.A.(SOCIOLOGY ), M.L.M.(Labour Management), Pursuing MBA(EXECUTIVE) in (FASHION-TECH), MISTE.,
Chennai, India
Cell: +91-9283182955
Email: rsbalakumar1953@gmail.com
Statistical quality control:
Diagrammatic representation like histogram, circle diagram, pare to chart, scatter diagram, showing the defective status of the garment produced in the mass production section is called statistical quality control.
Quality controllers must have a thorough knowledge of this SQC.
Managing quality through inspection:
In the begging to obtain an overall picture of where you stand in terms of quality, perform 100%. Final inspection of all style for at least two or three weeks and collect information. The following variation defects to look for:
A histogram is a bar chart or a bar graph. It is a graphical depiction of a number of occurences of an event. Histogram simply shows the distribution of sample data and give some idea about variability or that data. Histogram is a graphic summary of variation in a set of data, and is a simple but most powerful tool for elementary analysis. A histogram can help understand the total variation or a process, and quickly and easily determine the under laying distribution or a process.
Pareto chart:
A pareto chart is nothing but a histogram where a number of occurences of an event or arranged in descending order. Thus , pareto chart helps to identify those effects that causes most problem can be sloved and improvement be made.
For example, of the 208 defect shown in the pareto chart, 45 or 21.6% are fabric defects so in this instance, it would be most effective to address fabric quality first because any improvement in the fabric quality will significantly improve overall quality of the product the next defect to address should be open seams, and so forth.
Source:
Managing Quality in the apparel industry -by Pradip. V. Mehta & Satish.K.Bhardwaj
Quality controllers must have a thorough knowledge of this SQC.
Managing quality through inspection:
In the begging to obtain an overall picture of where you stand in terms of quality, perform 100%. Final inspection of all style for at least two or three weeks and collect information. The following variation defects to look for:
- Broken button
- Broken snaps
- Broken stitching
- Defective snaps
- Different shades within the same garment
- Dropped stitches
- Exposed notches
- Exposed raw edges
- Fabric defects
- Holes
- Inoperatives zippers
- Loose/hanging sewing threads
- Misaligned buttons and button holes
- Missing buttons
- Needle cuts/chews
- Open seams
- Pulled/loose yarns
- Stain
- Unfinished button holes
- Zipper too short
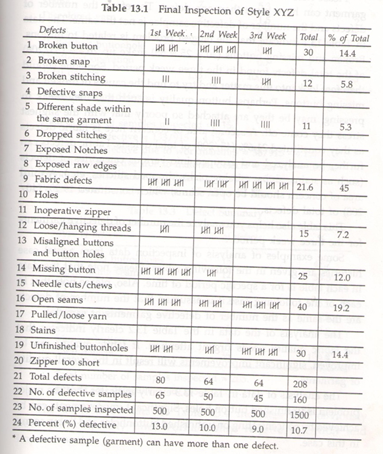 |
| Final inspection of style-XYZ01 |
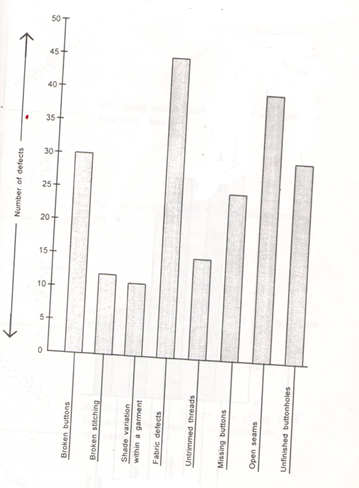 |
| Histogram |
A pareto chart is nothing but a histogram where a number of occurences of an event or arranged in descending order. Thus , pareto chart helps to identify those effects that causes most problem can be sloved and improvement be made.
For example, of the 208 defect shown in the pareto chart, 45 or 21.6% are fabric defects so in this instance, it would be most effective to address fabric quality first because any improvement in the fabric quality will significantly improve overall quality of the product the next defect to address should be open seams, and so forth.
Source:
Managing Quality in the apparel industry -by Pradip. V. Mehta & Satish.K.Bhardwaj